Visualization of world population distribution
The “Statistics Bureau, Ministry of Internal Affairs and Communications” in Japan, the “Eurostat” in Europe, and the “United States Census Bureau” in the US regularly conduct census.
Here you can see the population distribution from the European, American and Japanese censuses.
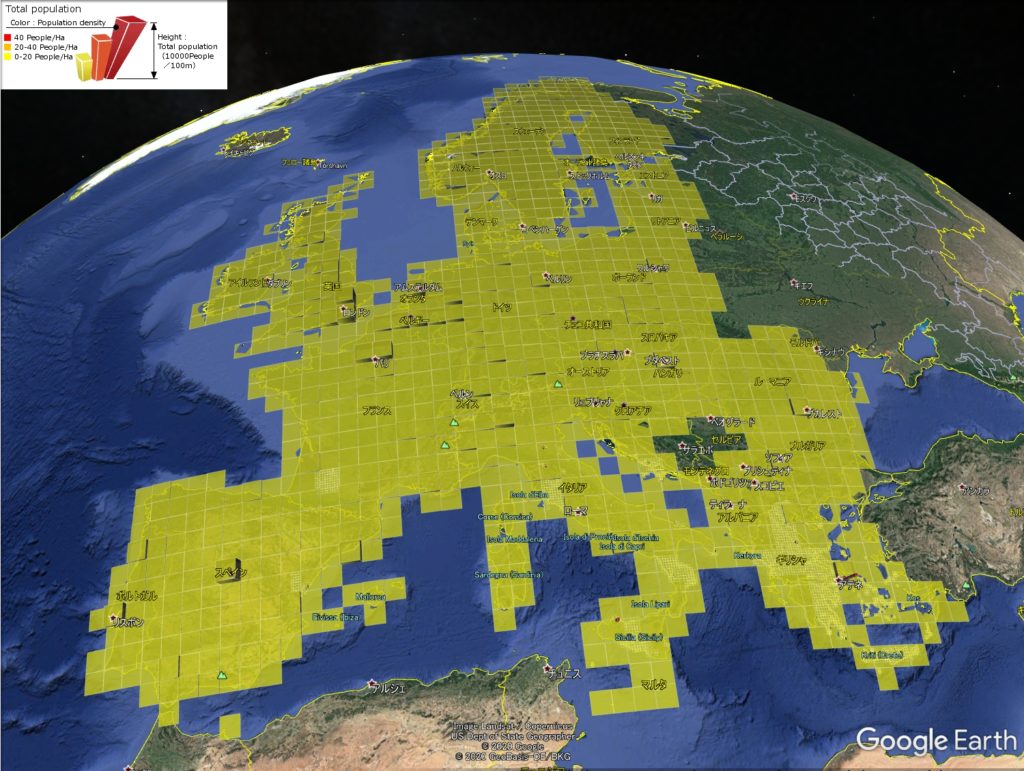
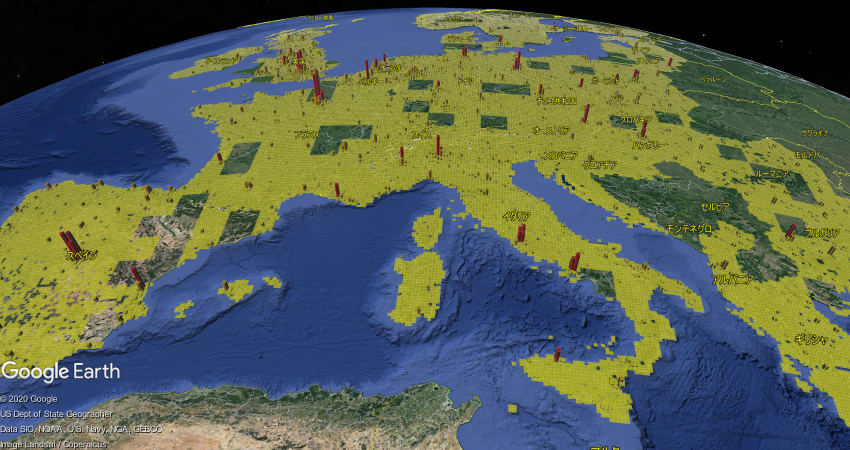
Population in Europe (2011)
The height of the statistical grid indicates the resident population, the color indicates the resident population density, and the length of one side of the grid automatically switches from about 80 km to about 1 km according to the scale.
Let’s visualize the sweep of the population throughout Europe. How is it different from the population concentration in the US and Japan?

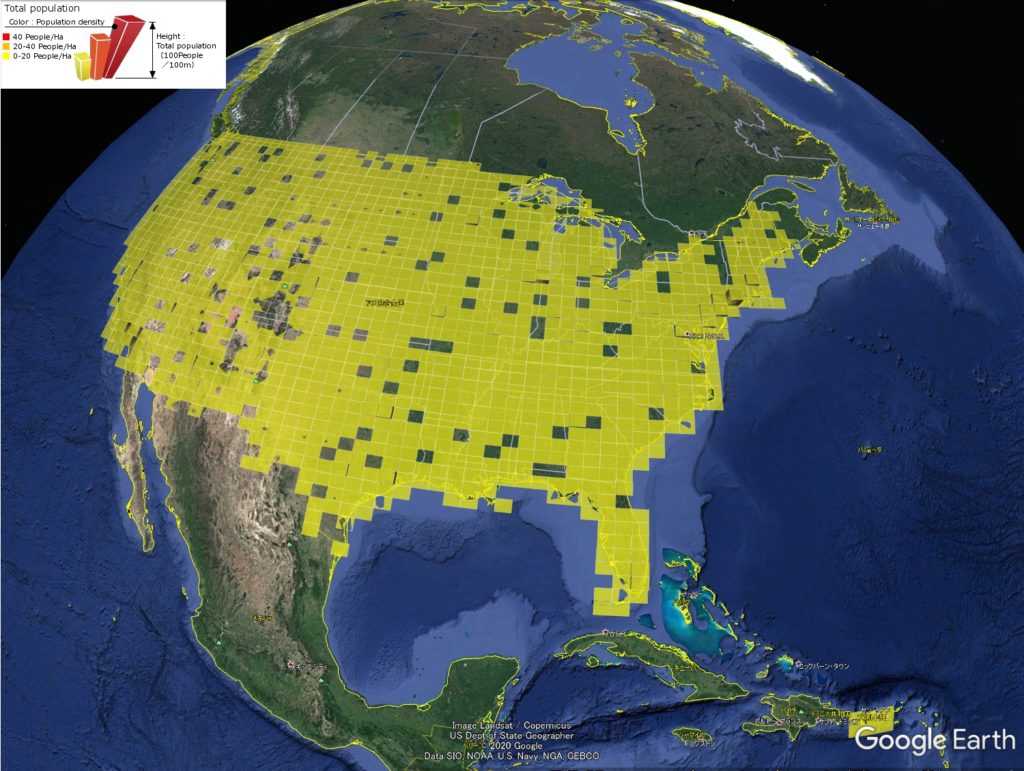
Population in the US (2010)
The height of the statistical grid indicates the resident population, the color indicates the resident population density, and the length of one side of the grid automatically switches from about 80 km to about 1 km according to the scale.
Let’s visualize the sweep of the population throughout United States. How is it different from the population concentration in Europe and Japan?

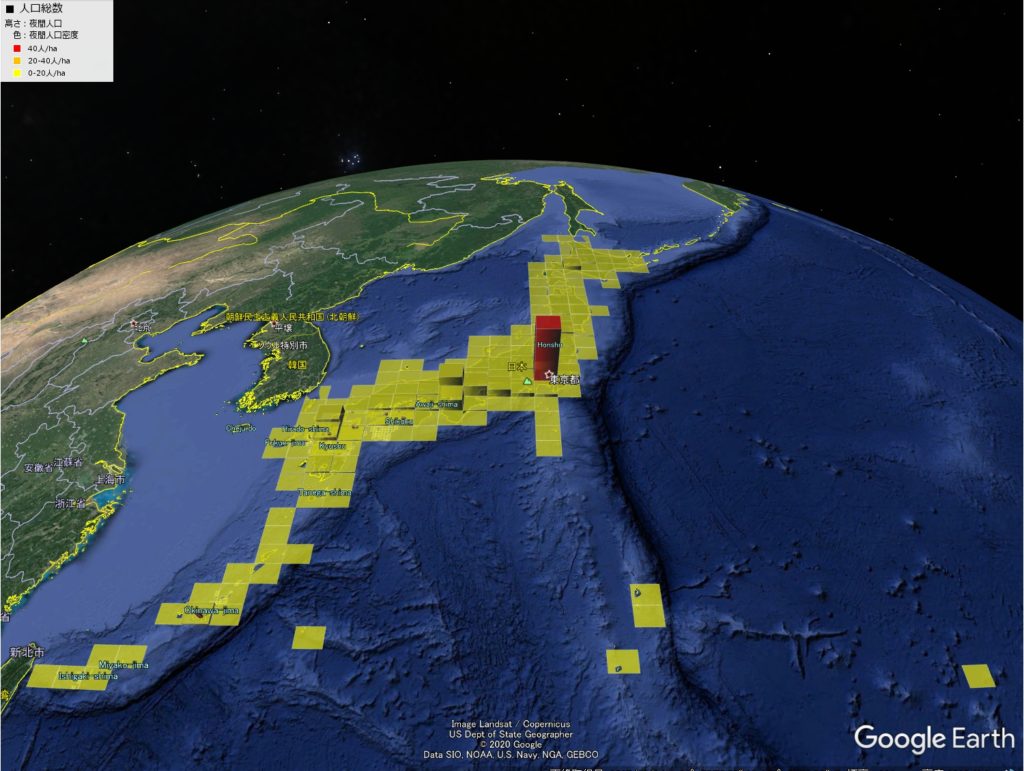
Population in Japan (2010)
The height of the statistical grid indicates the resident population, the color indicates the resident population density, and the length of one side of the grid automatically switches from about 80 km to about 1 km according to the scale.
Let’s visualize the sweep of the population throughout Japan. How is it different from the population concentration in Europe and the US?

About the source
The following materials are used for processing and visualization of the data posted on this page.| Contents | Sourse | Materials / Data | Year |
|---|---|---|---|
| Population in Europe | Eurostat | GEOSTAT 1km2 population grid | 2011 |
| Population in US | Bureau of the Census | United States Census 2010 | 2010 |
| Population in Japan | Statistics Bureau, Ministry of Internal Affairs and Communications | 2010 Population Census | 2010 |


質問と回答コーナー FAQに見当たらない質問はこちらから!