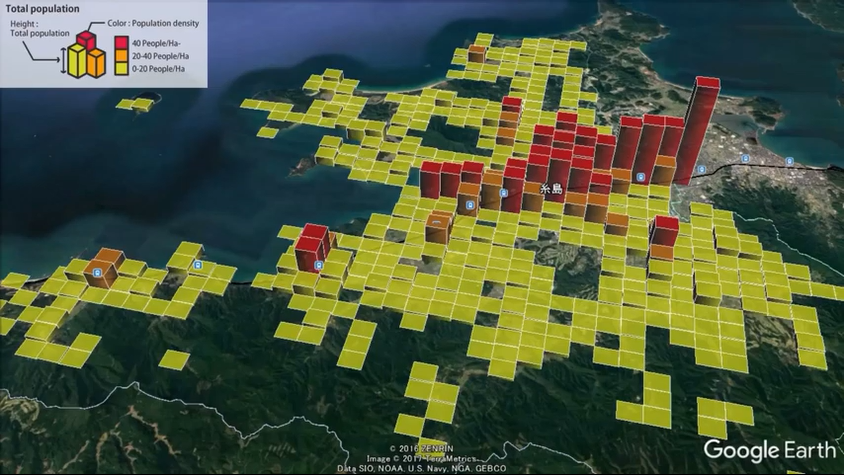
The main features of the urban structure visualization
- Visualizes various urban data, such as population and sales amount in 3D
- Available for download of KML format files and Visualization in Google Earth.
- Indicates regional characteristics (Color) and numerical information (Height) at the same time.
- Compares different regions at the same level. (Statistical Grid Data)
- Allows continuous urban secular change animation.
Displays in three dimensions
Users can intuitively understand the urban structure by displaying various statistical data in three dimensions.
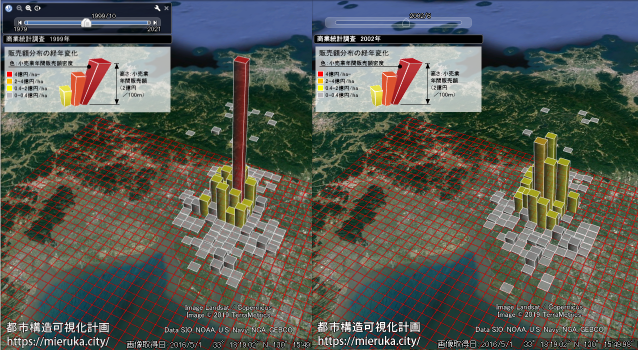
Secular change in the animation
Statistical surveys are carried out on a regular basis, so users can see the data of each survey year as the secular change animation.
In this video, we can understand that population of the central urban area is decreasing and dispersing thinly around.
Display of cross analysis & Confirmation of Street View
Allows for various analyses by cross analysis which use the Color and Height of the statistical grid data, and users can identify statistically distinctive areas by integrating with Google Street View.
| Color | Height |
| Regional characteristics, such as public transportation accessibility and area classification. | Statistical numerical information, such as number of population and sales amount. |
| Not only regional characteristic, but also statistical numerical information is indicated by Color. (e. g. population density) | The higher the height, the greater the accumulation of numerical values. |

質問と回答コーナー FAQに見当たらない質問はこちらから!